
Press Releases
Marriage and Parenthood Trends in Singapore
1 June 2012
Explore the key trends behind Singapore's falling birth rates, and learn about the Government's efforts to support marriage and parenthood.
Introduction
This paper discusses marriage and parenthood trends in Singapore and efforts to address our falling birth rates.1
PART I
Marriage and Parenthood Trends in Singapore
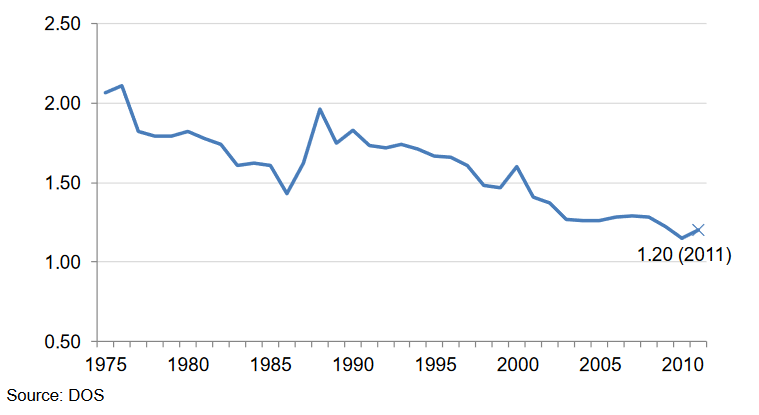
Singapore’s total fertility rate (TFR)2 has been on a general decline. The last time that the TFR of the resident population (comprising Singapore Citizens and Permanent Residents) was above the replacement level of 2.1 was in 1976. The resident TFR was 1.20 in 2011 (see Chart 1).
Singapore’s total fertility rate has been declining
Chart 1: Resident total fertility rate, 1975-2011
The declining trend in TFR is a serious and complex issue, and can be attributed to the following key factors: a. More people are staying single or getting married later, and b. Married couples are having their first child later and having fewer children.
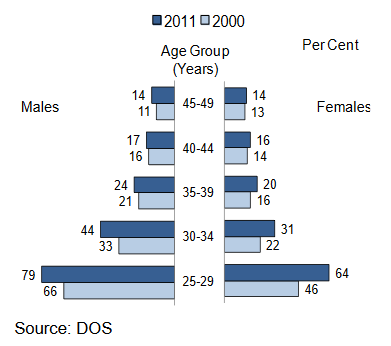
The proportion of singles has increased across all age groups between 2000 and 2011. Among citizens aged 30 - 34 years, singlehood rates increased from 33% to 44% for males, and from 22 % to 31% for females (see Chart 2). The median ages of citizens at first marriage has also risen, from 28.5 to 30.1 years for grooms and from 26.1 to 27.8 years for brides during this period (see Table 3).
More Singaporeans are staying single
Chart 2: Proportion of citizen singles by age group and sex
Singaporeans are marrying and having their first child at a later age
Table 3: Median age of citizens at first marriage, and median age of citizen mothers at first birth
2000 | 2010 | 2011 | |
|---|---|---|---|
Median age at first marriage | |||
Citizen Grooms | 28.5 | 30.0 | 30.1 |
Citizen brides | 26.1 | 27.6 | 27.8 |
Median age at first birth | |||
Citizen mothers | 28.6 | 29.8 | 29.8 |
Source: DOS, ICA
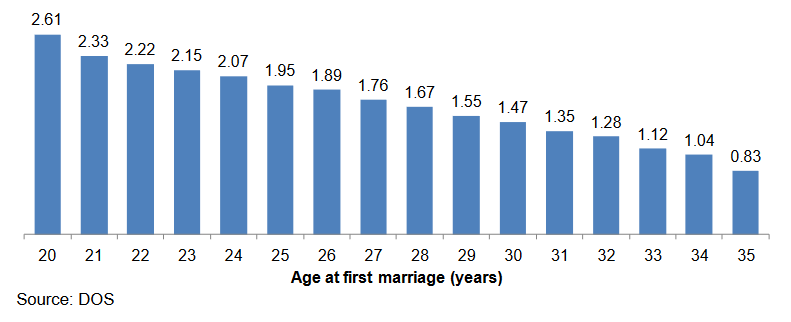
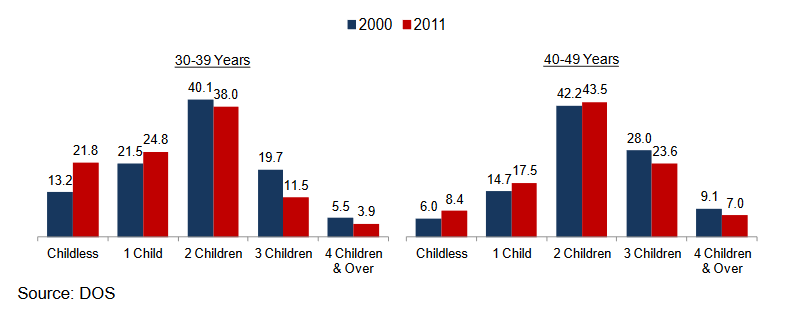
Later marriages lead to a delay in family formation and tend to result in families having fewer children. For example, among ever-married women born in 1965 to 1970, those who married at age 28 had an average of 1.67 children by age 40, whereas those who married at age 35 had 0.83 children (see Chart 4). The median age at which citizen ever-married women had their first child rose to 29.8 years in 2011 (see Table 3). While two-child families remain the norm, the average number of children born to citizen ever-married females aged 40 - 49 has been falling, from 2.22 in 2000 to 2.06 in 2011. The proportion of ever-married women with no children or 1 child has increased in recent years (see Chart 5).
Women who marry later tend to have fewer children
Chart 4: Average number of children born to ever-married citizen females among the 1965 - 1970 birth cohorts at age 40 years, by age at first marriage
Married couples are having fewer children
Chart 5: Distribution of citizen ever-married females by age group and number of children born
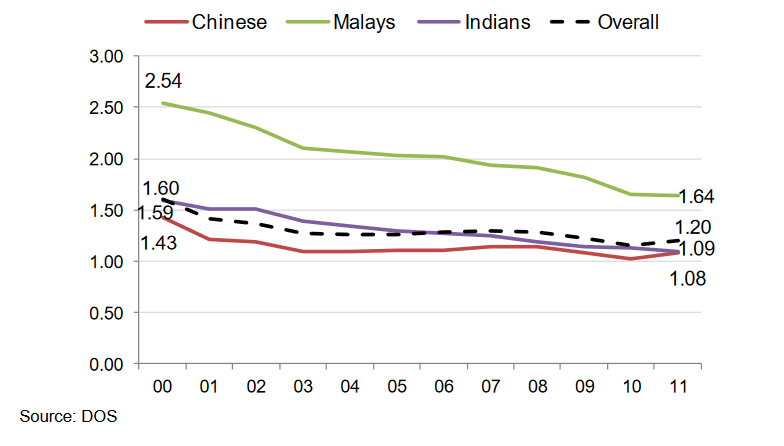
The decline in birth rates is observed across all ethnic groups. Chinese TFR has remained the lowest among the three main ethnic groups (see Chart 6).
Fertility rates have declined across all ethnic groups
Chart 6: Resident TFR by ethnic group of mother
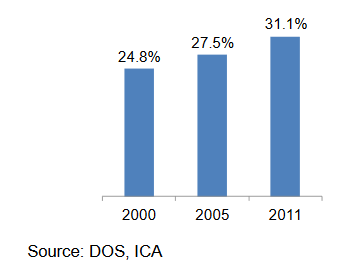
In line with the increasingly globalised nature of Singapore society, a significant proportion of marriages are between citizens and non-citizens (see Chart 7). As a result, the share of citizen births to citizen/non-citizen parents has increased in recent years. In 2011, 31.1% of citizen births had a non-citizen parent at the time of birth, as compared to 24.8% in 2000 (see Chart 8).
More Singaporeans are marrying and starting families with non-Singaporeans
Chart 7: Proportion of citizen/non-citizen marriages among marriages involving at least one citizen
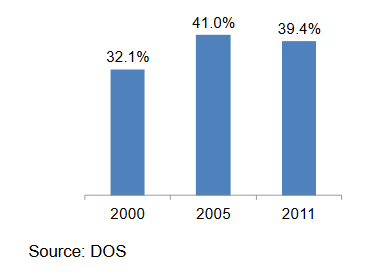
Chart 8: Share of citizen births to citizen/non-citizen couples, as a percentage of total citizen births
Measures to support Marriage and Parenthood
Encouraging marriage and parenthood is a priority for the Government. The Government provides a broad range of measures to support Singaporeans’ aspirations of getting married and having children.
To help singles find their life partner, the Social Development Network reaches out to around 100,000 singles each year to provide them with more social interaction opportunities.
There are housing schemes to help couples set up home. The Housing & Development Board has significantly increased the supply of Build-to-Order (BTO) flats, and priority is given to first-time applicants in purchasing their flats. Young couples can also apply for CPF Housing Grants (such as the Family Grant and the Additional CPF Housing Grant) to help them finance the purchase of public housing.
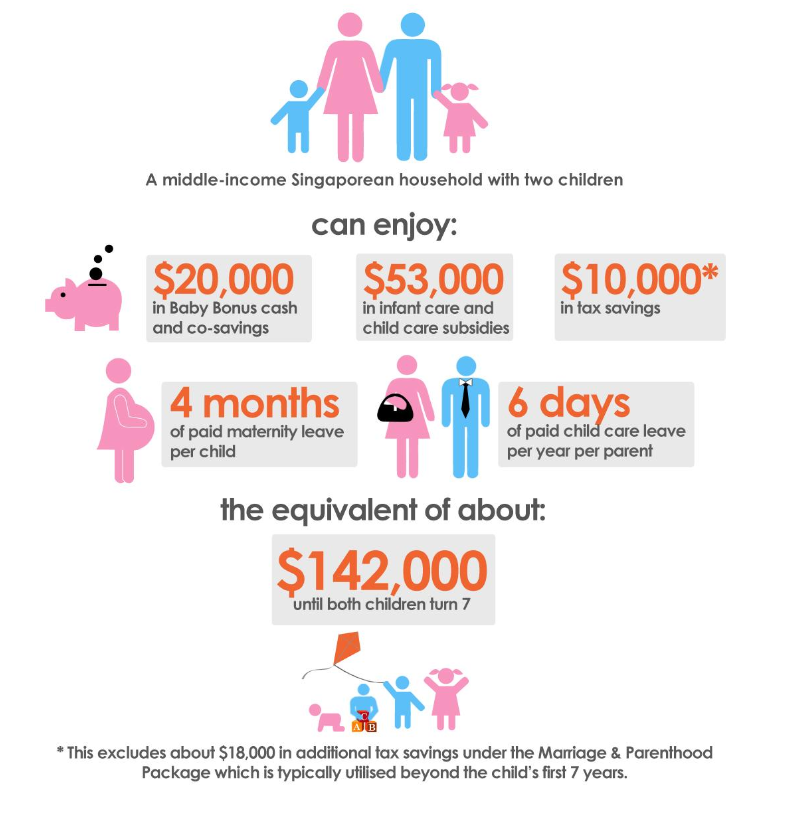
To help parents defray the costs of raising children, there is the Baby Bonus Scheme, comprising a cash gift and the Child Development Account (CDA) with matching co-savings from the Government. Subsidised education and healthcare, as well as significant tax rebates and tax reliefs also help to ease child-raising costs.
In the area of work-life support, mothers have maternity leave of 16 weeks. To facilitate shared parental responsibilities in looking after children, each parent has paid child care leave of 6 days per year for children up to age 7, and an additional 6 days of unpaid infant care leave per year for children up to age 2.
To provide parents with child care options, the Government has focused on improving the quality, affordability and accessibility of child care services. Parents can qualify for child care subsidies and tap on the savings in their child’s CDA to pay child care fees. To improve the quality of child care, the Government funds scholarships and teaching awards to attract more teachers into the child care sector. Efforts have also been stepped up to build new centres in housing estates with high demand. Since implementation in 2001, the families of some 350,000 children have benefited from the measures under the Marriage and Parenthood Package, which was last enhanced in 2008 to $1.6 billion a year. A summary of Singapore’s measures to encourage marriage and parenthood can be found in the Annex.
Singapore’s Marriage and Parenthood Package
PART II
International Demographic Situation
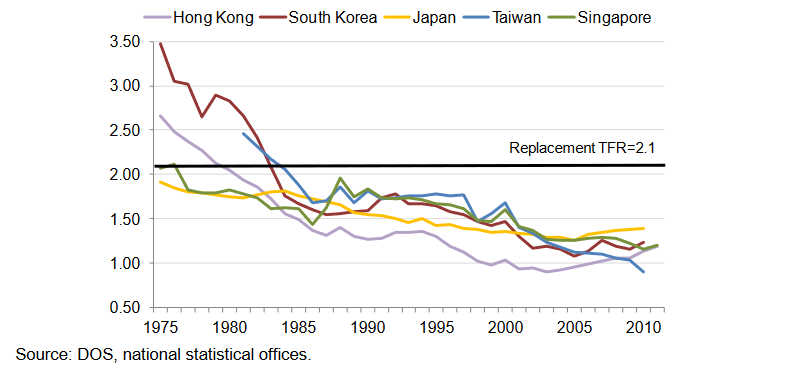
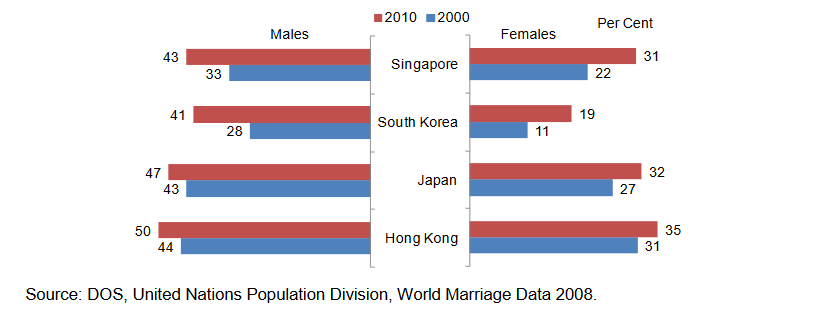
Most developed societies have TFRs below the replacement rate. Singapore has experienced declining TFR similar to that of other East Asian developed societies such as Hong Kong, Japan, South Korea and Taiwan, which registered TFRs of between 0.90 and 1.39 in 2010 (see Chart 9). These societies are also experiencing later marriages and rising singlehood (see Chart 10), due to factors such as rising levels of educational attainment and better employment opportunities. In Hong Kong, Japan and South Korea, the average age at marriage is 29-30 for women and 31-33 for men.3
Fertility rates in developed East Asian societies have been on the decline Chart 9: TFR comparison of selected developed societies in East Asia and Singapore
A rising proportion in developed East Asian societies are staying single Chart 10: Proportion of singles aged 30-34 by sex, selected East Asian developed societies4
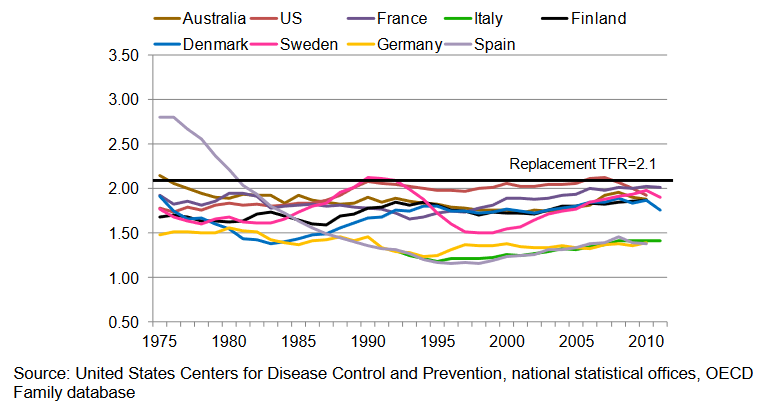
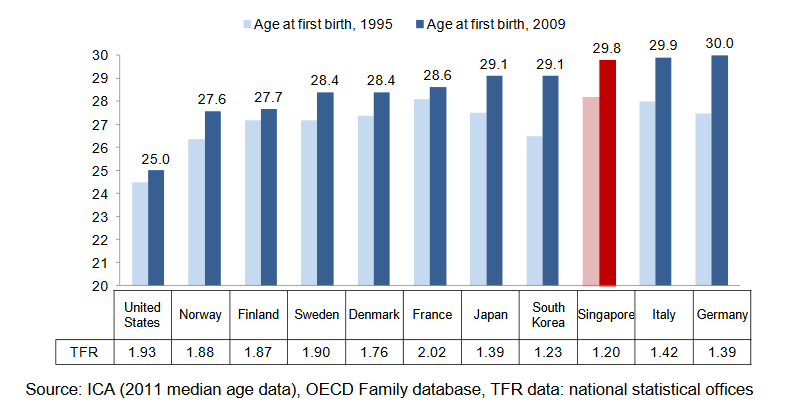
While many developed countries continue to grapple with low birth rates, a few countries have seen an improvement in their fertility rates in recent years and have TFRs closer to the replacement rate (see Chart 11). For example, Sweden and Denmark have TFRs of 1.90 and 1.76 respectively. In these countries, a greater proportion of women have children, and have their first child at an earlier age (see Chart 12).
Fertility rates in some developed countries have improved in recent years
Chart 11: International TFR comparison of selected developed countries in Europe, US, and Australia
Women have children at a younger age in countries with higher fertility rates
Chart 12: Average age at first birth and TFR in selected countries6
This can be partly attributed to the social and cultural contexts in these countries. For instance, some provide substantial support for mothers with children, and their workplace culture tends to be more supportive of parenting needs. However, the main difference is that these societies have more children born outside of marriage, ranging from 30% to more than 50%, compared to 1.5%-2.0% in East Asian societies.7 Out-of-wedlock births would be a significant departure from Singapore’s societal norms, and are likely to lead to major changes in the make-up of our society and give rise to other social issues.
Box 1: Pro-Parenthood Policies in Other Developed Societies Singapore, like other developed societies, has adopted pro-parenthood policies such as financial support, leave provisions and flexible-work options for parents. While pro-parenthood policies may have some impact on fertility trends, bringing up children is affected by a complex interplay of multiple factors such as prevailing social and cultural norms, as well as general economic conditions which could have an impact on parents’ income, employment and view of the future. A summary of Singapore’s measures to encourage marriage and parenthood can be found in the Annex. Examples of pro-parenthood policies in other developed societies are provided below. I. Support in balancing work and raising children
Japan, South Korea, Denmark, Finland, France, Sweden and the UK have measures to reduce the trade-offs women face between work and child-bearing, such as child care services, leave provisions, as well as part-time and flexible-work options.
A. Good quality, affordable child care services.8 Some countries in Europe provide various forms of access to child care services.9 In France and Italy, children have access to 3 years of free full-day child care. In the UK, children can have 2 years of free half-day child care. While parents in South Korea, Denmark, Norway and Sweden have to pay for child care services, there are significant government subsidies.
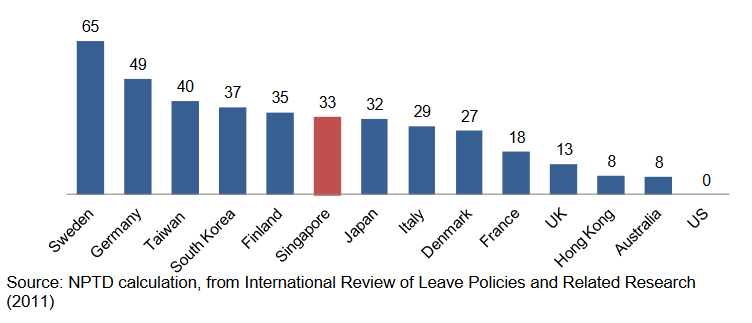
B. Leave provisions, part-time and flexible-work options. Many developed societies provide between 8 and 65 weeks of full-wage equivalent leave.10 Some also have employment protection legislation to give parents the option of unpaid leave to take care of young children. A comparison of full-wage leave provisions is at Chart 13. In the area of flexible work options, Japanese and Swedish parents with children under 3 and 8 respectively can have reduced working hours.11 Parents in the UK can also have flexible working hours if they have children under 6.12
Leave provision for parents
Chart 13: Total leave provisions for both parents for each child (in full-wage equivalent weeks)
II. Shared parental responsibility Some countries have policies to encourage both parents to share the responsibilities for bringing up children. Some provide shared parental leave for fathers and mothers, whilst others, such as South Korea, Sweden and UK, earmark parental leave for fathers.13
III. Financial support. Various developed countries help parents defray the costs of raising children through subsidising the cost of children’s developmental needs, such as education and healthcare. Some countries, including Japan, Australia and Denmark provide parents with monthly child allowances covering children up to the ages of 15 to 21.14 Governments in Japan, Taiwan, Australia and France give parents a cash gift upon childbirth.
Conclusion
Below-replacement fertility is a global phenomenon in developed countries which will affect the rate of population ageing, the citizen population size, the number of working-age citizens and the ratio between the elderly and working-age population.
Encouraging marriage and parenthood is a key Government priority to address the population challenge. We will continue to learn from the experiences of other countries which have shown success. However, even if we apply the same practices, we may not get the same outcomes. We will need to develop an approach best suited to our circumstances, cultural norms and socio-economic conditions.
The Government is reviewing policies and measures to support citizens in getting married and having children. As part of the public engagement leading to the White Paper on Population, we welcome suggestions on how to improve Singapore’s birth rate, and how different stakeholders can play a part in promoting marriage and parenthood and fostering a supportive environment for family life. (We welcome you to submit your suggestions through the REACH portal.)
Download annex here (opens in new tab).
1 Citizen data has been used for this Occasional Paper, except Total Fertility Rate (TFR), which is based on resident data for international comparison.
2 TFR is the average number of children that would be born to a hypothetical woman over her lifetime if she experiences the exact same age-specific fertility as current cohorts of women of child-bearing age (i.e. women aged 15 - 49). Age-specific fertility refers to the average number of children born to women of specific age groups, e.g. women aged 30 - 34.
3 Source: Asian demography: The flight from marriage (The Economist, 20 Aug 2011).
4 Data as of 2000 & 2005 for Japan and South Korea, as of 2001 & 2006 for Hong Kong, and as of 2000 & 2010 for Singapore.
5 Data as of 2011. Source: national statistical offices.
6 TFR data as of 2011 for France, Italy, Denmark, Sweden, Norway, Japan and Singapore, and as of 2010 for US, Germany, Finland and South Korea.
7 Data as at 2009. Source: OECD family database (2011).
8 OECD policy brief “Can Policies Boost Birth Rates?” (2007).
9 The minimum age criterion for coverage differs from country to country. E.g. in Finland, there is no minimum age, while in the Netherlands and Ireland, access to child care services is provided to children aged 4 and above. For Sweden, access is provided for parents who are working or studying. Source: OECD report on Early Childhood Education and Care, “Starting Strong II” (2006).
10 Based on OECD methodology, full-wage equivalent leave refers to the number of weeks of leave available if leave were paid at 100%. E.g. 10 weeks of leave at 80% of wage would be 8 weeks of full-wage equivalent leave. Singapore provides 33 weeks of full-wage equivalent leave in total. (For comparability with OECD country data on leave provisions, 5 days of leave is taken as 1 week.) Source: OECD Family database – Key characteristics of parental leave systems.
11 Japan’s Ministry of Health, Labour and Welfare website, (2010). OECD “Babies & Bosses” (2007).
12 UK’s Advisory, Conciliation and Arbitration Service website (2011).
13 International Review of Leave Policies and Related Research (2011).OECD Family Database – Key Characteristics of parental leave (2007).
14 OECD Family Database–Family cash benefits (2011)