
Press Releases
Citizen Population Scenarios
1 April 2012
Read to find out how falling birth rates and an ageing population shape Singapore's citizen numbers.
Highlight
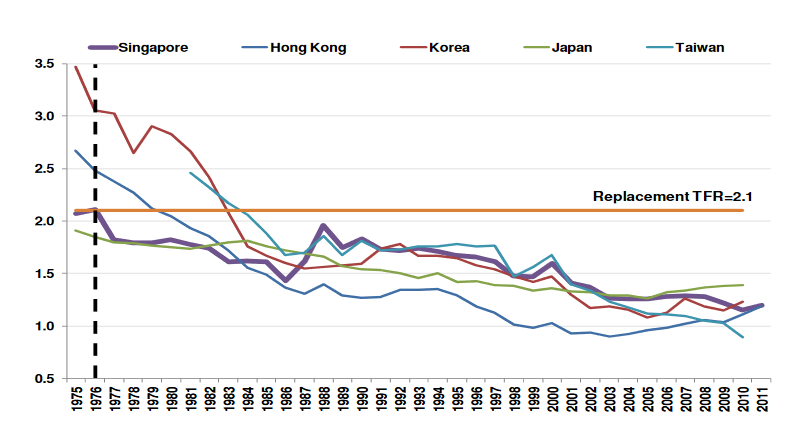
Like most East Asian urbanised societies, Singapore’s Total Fertility Rate has been declining. At the same time, Singaporeans are living longer. Our life expectancy is currently one of the highest in the world.
At current birth rates and without immigration, our citizen population is projected to shrink by around 2025.
2012 is a demographic turning point. Our first cohort of post-war Baby Boomers born between 1947 and 1965 will start turning 65 years old from this year. By 2020, as more citizens exit the working-age band of 20 to 64 years than those entering, the pool of working-age citizens will start to shrink.
Our citizen population will age, and age rapidly. By 2030, the number of elderly citizens will triple to about 900,000, but they will be supported by a smaller base of working-age citizens. The median age of our citizen population will rise from 39 years in 2011 to 47 years in 2030.
Citizen Population Scenarios
Introduction
This paper discusses the demographic characteristics of our citizen population under various scenarios. The population scenarios are not predictions or forecasts, but are illustrations of the growth and change in population that would occur if certain assumptions about future demographic trends were to prevail over the projection period. These assumptions may or may not be realised1. Our citizen population demography is dependent on the following key factors: i. Total Fertility Rate (TFR)
ii. Life expectancy
iii. Migration
Total Fertility Rate (TFR)
Singapore’s TFR has been declining
Singapore faces the twin challenge of declining birth rates and an ageing population. First, our TFR has been below that needed to replace ourselves2 since 1976. This is a common challenge faced by other East Asian urbanised societies such as Hong Kong, Taiwan, South Korea and Japan (See Chart 1)
Chart 1: International comparison of TFR3
The Government supports Singaporeans in getting married and having children. Our Marriage and Parenthood package was introduced in 2001 to provide a broad range of measures to help with child-raising costs, childcare support, and time spent with young children. The Marriage and Parenthood package was enhanced twice from $500 million in 2001, to $800 million in 2004 and doubled to $1.6 billion a year in 2008. The Government will continue to fine-tune its policies and measures to encourage Singaporean families to raise children.
Life Expectancy
At the same time, Singaporeans are living longer
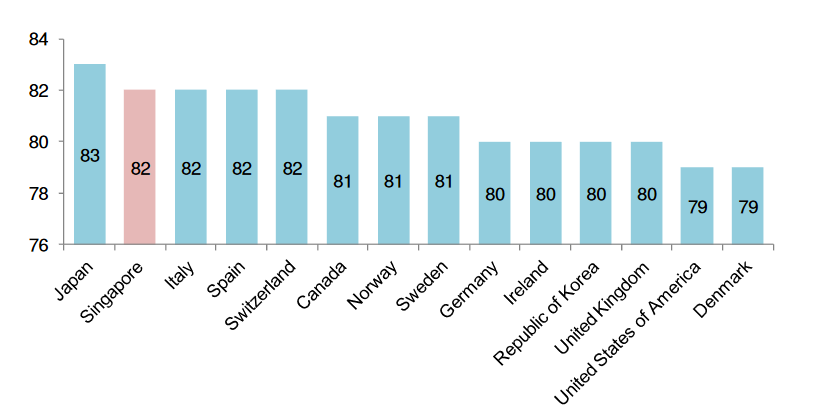
Second, Singapore’s life expectancy has improved steadily over the last three decades from 72 years in 1980 to 82 years in 2010 (See Chart 2). Our life expectancy is close to that of Japan’s, and currently one of the highest in the world (See Chart 3).
Chart 2: Life expectancy of Singapore residents at birth by gender (yrs)
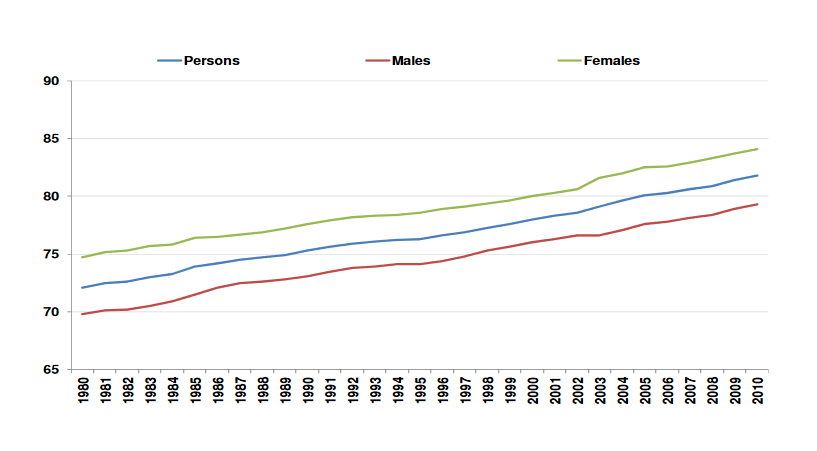
Chart 3: International comparison of life expectancy at birth (yrs)4
Explanation of Scenarios
This paper models the citizen population under various scenarios. Scenario A is a hypothetical scenario where we assume that our citizens begin to replace ourselves from this year. This means that our TFR is assumed to be 2.1. Scenarios B to E assume current TFR of 1.2 but with different levels of intake of new citizens each year. (See Table 1).
Table 1: Summary of scenarios
Parameters | Scenarios | ||||
|---|---|---|---|---|---|
A Replacement TFR 2.1 | B No immigration, current fertility | C 15K new SC, current fertility | D 20K new SC, current fertility | E 25K new SC, current fertility | |
TFR(per female) | 2.1 | 1.2 | 1.2 | 1.2 | 1.2 |
Number of citizenships granted(per yr) | 0 | 0 | 15,000 | 20,000 | 25,000 |
Citizen Population Size
At current birth rates and without immigration, our citizen population is projected to shrink around 2025
Without immigration, and if our current low TFR and high life expectancy continue, the number of citizen deaths is projected to outstrip births by around 2025 (See Chart 4). At that point, our citizen population will start to decline (See Scenario B in Chart 5).
Chart 4: Projected number of citizen births and deaths under the ‘no immigration’ scenario (‘000)
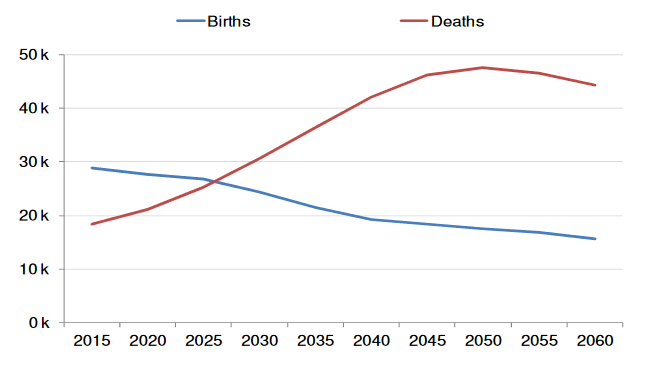
Chart 5: Citizen population size (‘millions)
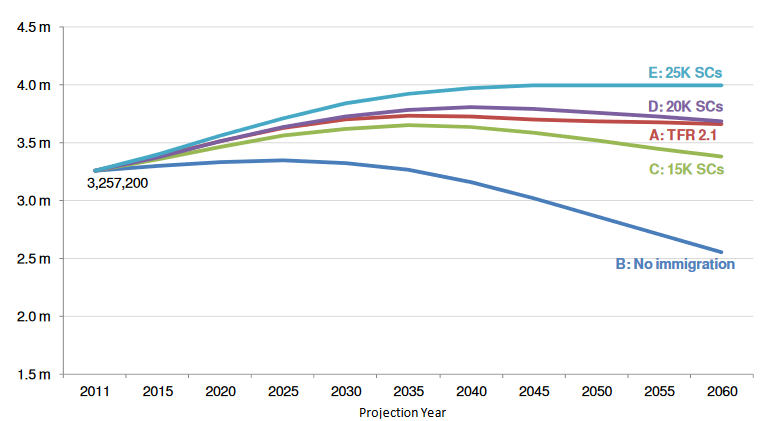
Raising our TFR (See Scenario A in Chart 5) and immigration (See Scenarios C-E in Chart 5) will delay and slow down the rate at which our citizen population declines. An immigration inflow of between 20K and 25K new citizens each year will keep the citizen population size stable. Working-Age Population Size
We will have fewer working-age citizens, hence a shrinking citizen workforce
Between now and 2030, Singapore will experience an unprecedented age shift, as over 900,0005 Baby Boomers will retire from the workforce and enter their silver years.
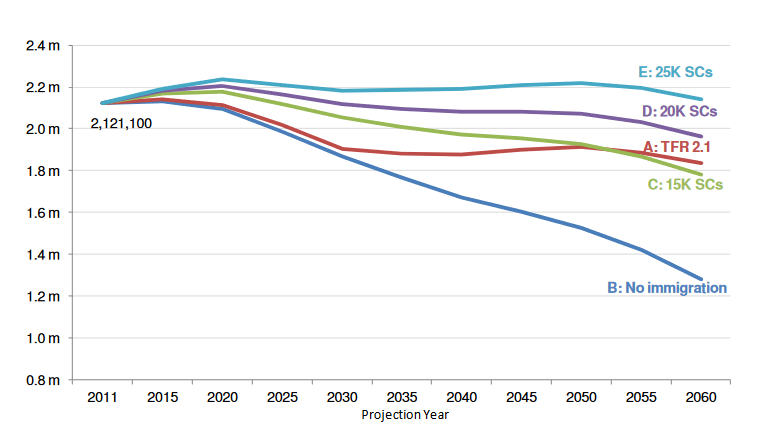
As more citizens retire and fewer enter the working-age band of 20-64 years, the number of citizens of working ages will start to shrink. At current TFR and without immigration,the size of our working-age citizen population will shrink drastically. (See Scenario B in Chart 6). This effect is mitigated by immigration. Immigration will slow down the decline of citizens in the working-age band. An inflow of 25K new citizens per year would keep the size of our working-age citizen population relatively stable (See Scenario E in Chart 6).
Chart 6: Number of working-age citizens (20-64 years) (‘millions)
Citizen Population Age Structure
Our citizen population will age, and age rapidly
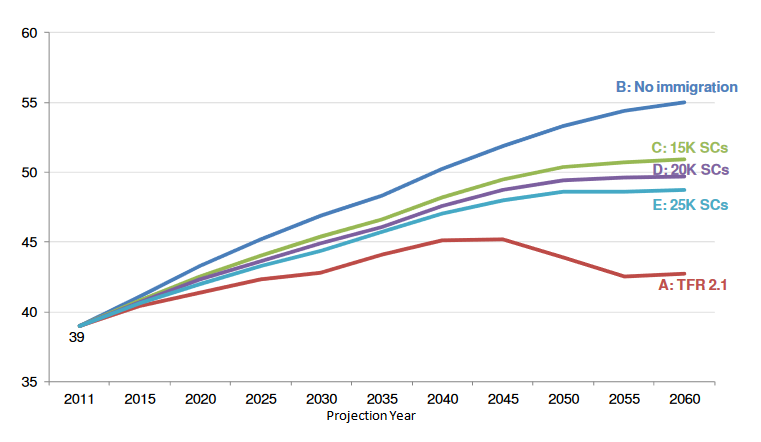
At current fertility and without immigration, our citizen population will age rapidly from a median age of 39 yrs in 2011 to 47 years in 2030 (See Scenario B in Chart 7). With immigration, the citizen population will still age, but at a slower rate (See Scenarios C-E in Chart 7).
Chart 7: Median age of citizen population (yrs)
-There will be fewer citizens at the working-ages to support the growing pool of elderly citizens_
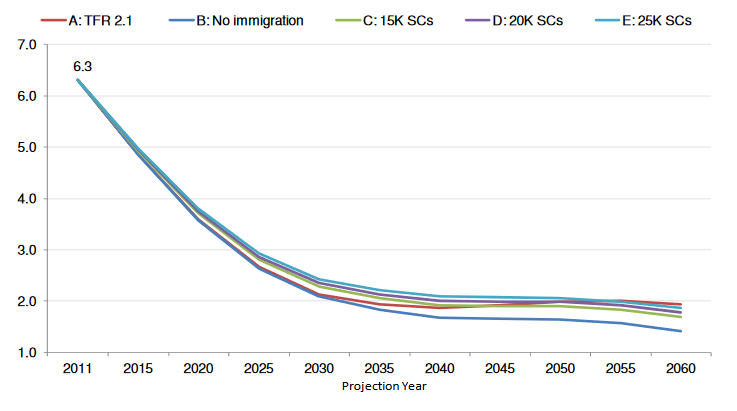
The shrinking working-age population and increasingly aged population will result in a deterioration of the citizen old-age support ratio. As of June 2011, there were 6.3 citizens in the working-ages of 20-64 years, to every citizen aged 65 years and above. With current fertility and no immigration, there will only be 2.1 working-age citizens to each elderly citizen by 2030 (See Scenario B in Chart 8). Immigration has a mitigating effect on the old-age support ratio (See Scenarios C-E in Chart 8).
Chart 8: Citizen old-age support ratio6 (persons aged 20-64 years per elderly citizen)
Summary
Below-replacement fertility rates and longer life expectancy affect our citizen population size, number of working-age citizens, median age and old-age support ratio. While Singapore presses on with efforts to encourage and support marriage and parenthood, raising TFR alone will not fully mitigate the effects of a declining and ageing citizen population, particularly in the next two decades. Immigration can help mitigate the rate at which our citizen population ages and declines, thereby revitalising our citizen population.
1 The population projections are carried out by the Singapore Department of Statistics using the standard demographic method of population projections (i.e. “cohort-component” method), with the assumptions on fertility and immigration specified by the National Population and Talent Division.
2 Replacement TFR is 2.1 per female.
3 Singapore: Singapore Department of Statistics (DOS), Taiwan: National Statistics , HK: Census and Statistics Department, Japan and Korea: OECD Family Database
4 Source: Singapore: Singapore Department of Statistics (DOS), others: World Health Organisation, 2009 5 29% of the citizen population as of June 2011
6 The old-age support ratio is generally computed as the ratio of persons aged 15-64 years to persons aged 65 years and over, following international practice and United Nations’ recommendations. However, with more persons aged 15-19 years remaining in school, this report computes the old-age support ratio as the ratio of persons aged 20-64 years to persons aged 65 years and over.